Edit chart
Loading graph
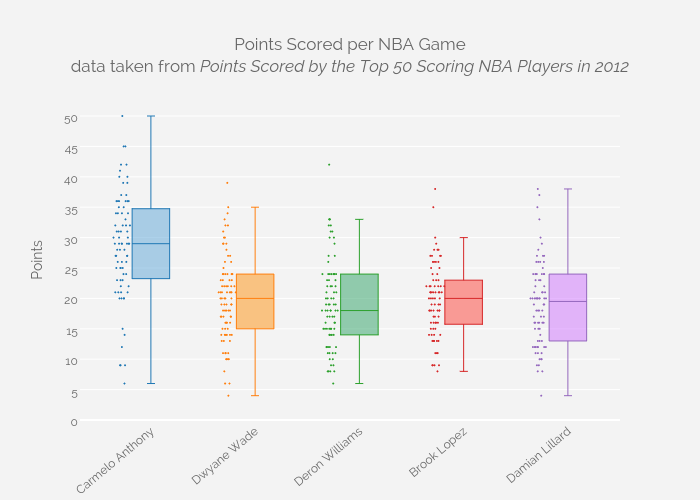
Cimar's interactive graph and data of "Points Scored per NBA Gamedata taken from Points Scored by the Top 50 Scoring NBA Players in 2012" is a box plot, showing Carmelo Anthony, Dwyane Wade, Deron Williams, Brook Lopez, Damian Lillard; with Points in the y-axis. The x-axis shows values from -0.6799999999999999 to 4.5. The y-axis shows values from 0 to 52.631578947368425.