Edit chart
Loading graph
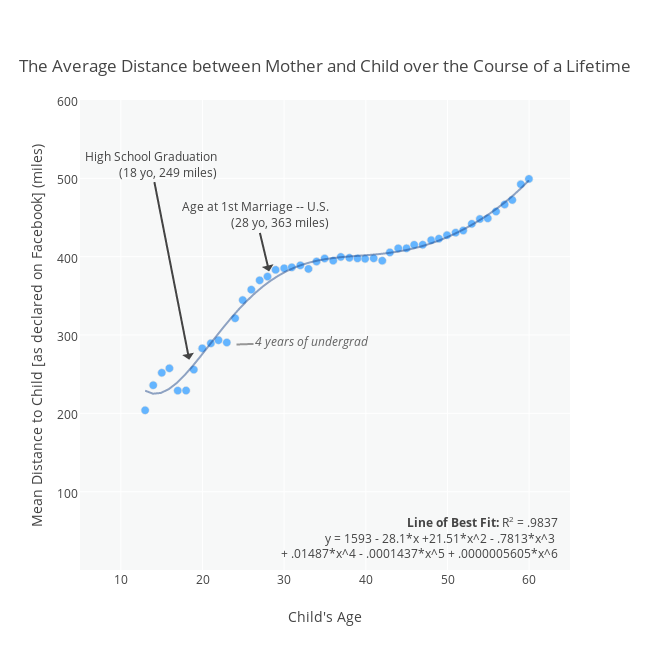
Cimar's interactive graph and data of "The Average Distance between Mother and Child over the Course of a Lifetime" is a scatter chart, showing Distance to Child vs y = 1593 - 281.4*x + 21.51*x^2 - .7813*x^3 + .01487*x^4 - .0001437*x^5 + .0000005606*x^6; with Child's Age in the x-axis and Mean Distance to Child [as declared on Facebook] (miles) in the y-axis.. The x-axis shows values from 5 to 65. The y-axis shows values from 0.1 to 600. This visualization has the following annotations: High School Graduation (18 yo, 249 miles); Age at 1st Marriage -- U.S. (28 yo, 363 miles); Line of Best Fit: R2 = .9837y = 1593 - 28.1*x +21.51*x^2 - .7813*x^3 + .01487*x^4 - .0001437*x^5 + .0000005605*x^6 ; 4 years of undergrad