Edit chart
Loading graph
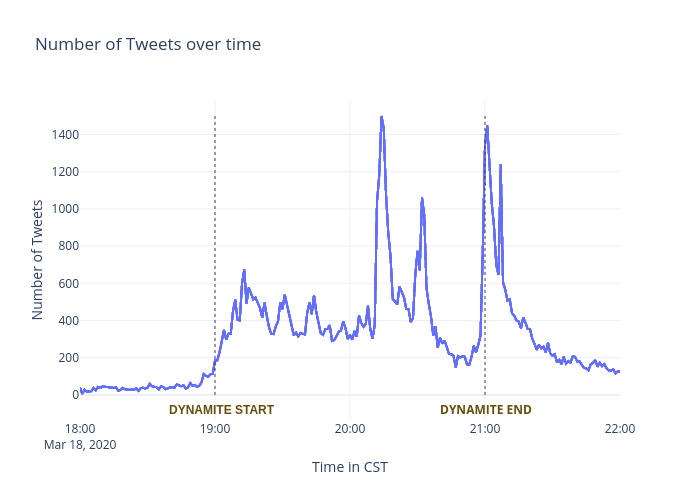
Cinhui's interactive graph and data of "Number of Tweets over time" is a line chart; with Time in CST in the x-axis and Number of Tweets in the y-axis.. The x-axis shows values from 2020-03-18 18 to 2020-03-18 22. The y-axis shows values from -138.63774211305213 to 1585.1914601112132. This visualization has the following annotations: DYNAMITE START; DYNAMITE END