Edit chart
Loading graph
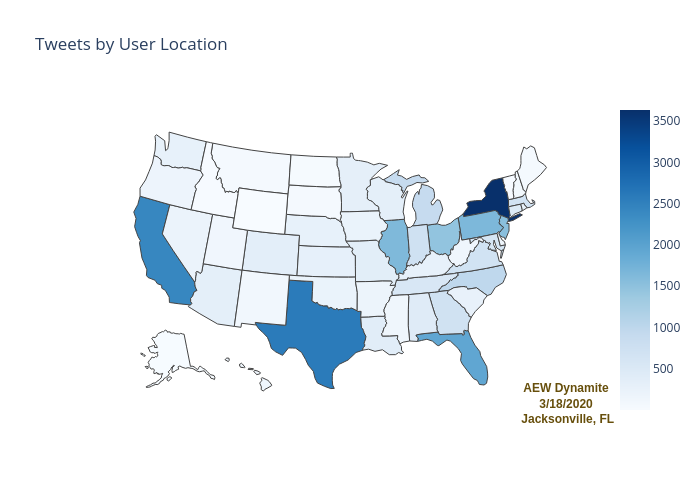
Cinhui's interactive graph and data of "Tweets by User Location" is a choropleth. The x-axis shows values from -0.31999999999999995 to 1.6800000000000002. The y-axis shows values from -0.8 to 1.2. This visualization has the following annotation: AEW Dynamite3/18/2020 Jacksonville, FL