Edit chart
Loading graph
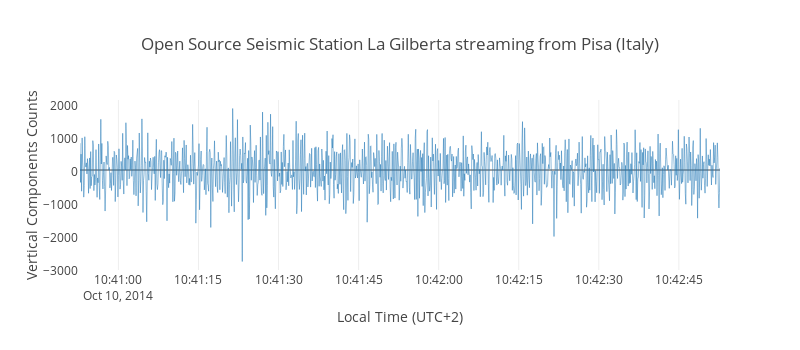
Cjunkk's interactive graph and data of "Open Source Seismic Station La Gilberta streaming from Pisa (Italy)" is a line chart, showing trace 0; with Local Time (UTC+2) in the x-axis and Vertical Components Counts in the y-axis.. The x-axis shows values from 1412930452703.216 to 1412930572603.092. The y-axis shows values from -3016.4444444444443 to 2112.4444444444443.