Edit chart
Loading graph
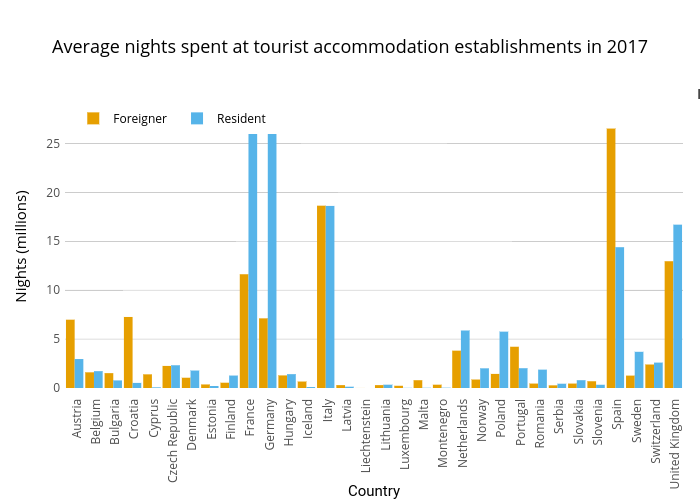
Cloudyolga's interactive graph and data of "Average nights spent at tourist accommodation establishments in 2017" is a grouped bar chart, showing Foreigner vs Resident; with Country in the x-axis and Nights (millions) in the y-axis.. The x-axis shows values from -0.5 to 31.5. The y-axis shows values from 0 to 28.94550947368421. This visualization has the following annotation: Is_Resident