Edit chart
Loading graph
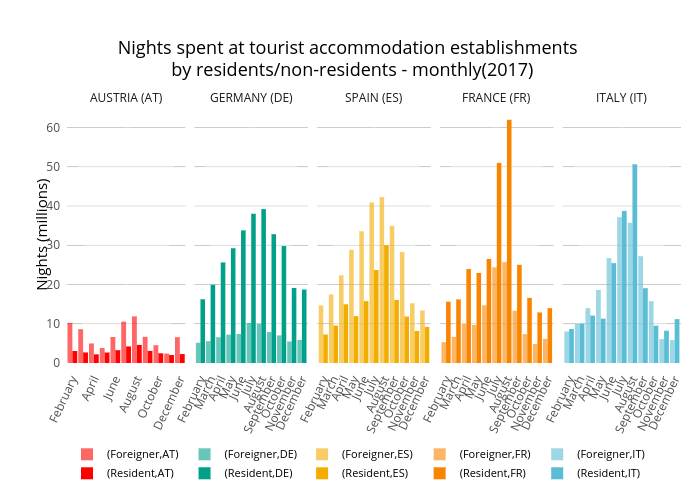
Cloudyolga's interactive graph and data of "Nights spent at tourist accommodation establishments by residents/non-residents - monthly(2017)" is a grouped bar chart, showing (Foreigner,AT), (Foreigner,DE), (Foreigner,ES), (Foreigner,FR), (Foreigner,IT), (Resident,AT), (Resident,DE), (Resident,ES), (Resident,FR), (Resident,IT). The x-axis shows values from -0.5 to 10.5. The y-axis shows values from 0 to 65.22873684210526. This visualization has the following annotations: Nights (millions); AUSTRIA (AT); GERMANY (DE); SPAIN (ES); FRANCE (FR); ITALY (IT);