Edit chart
Loading graph
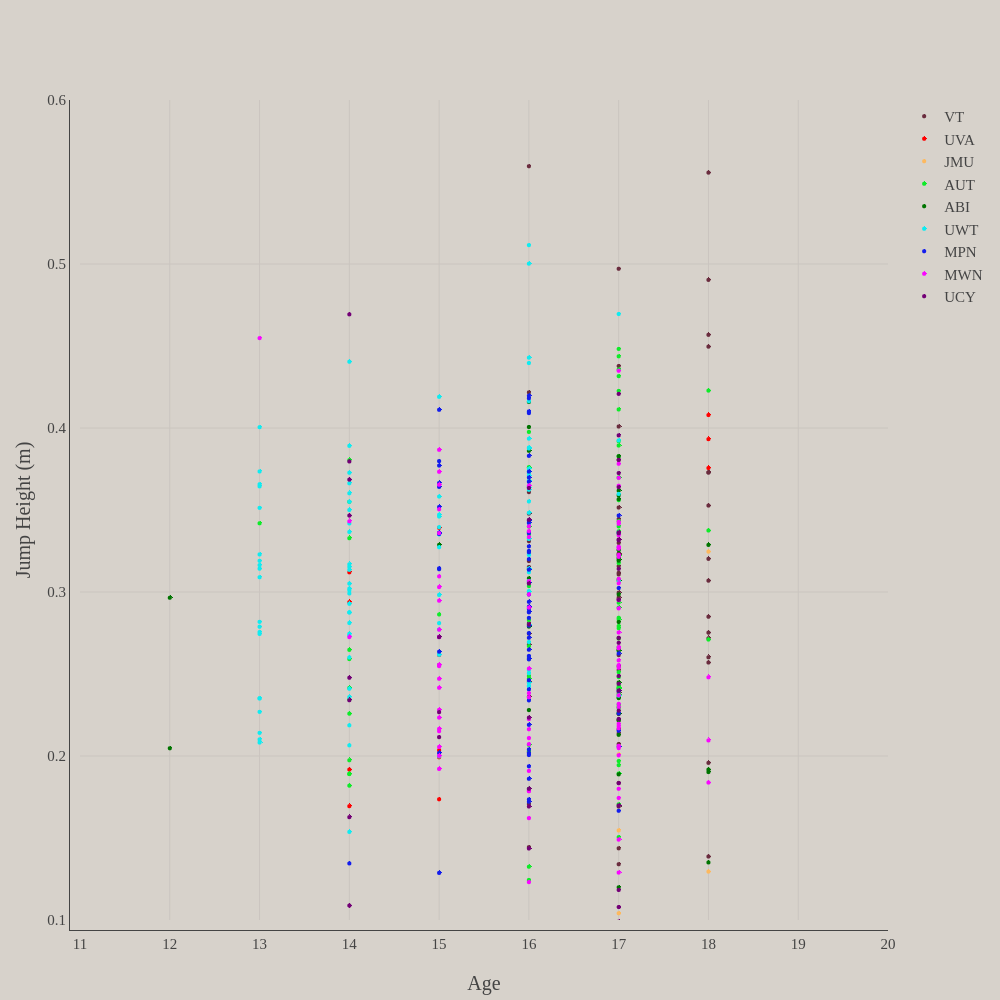
Cnh4ph's interactive graph and data of "Jump Height (m) vs Age" is a scatter chart, showing VT, UVA, JMU, AUT, ABI, UWT, MPN, MWN, UCY; with Age in the x-axis and Jump Height (m) in the y-axis.. The x-axis shows values from 11 to 20. The y-axis shows values from 0.1 to 0.6.