Edit chart
Loading graph
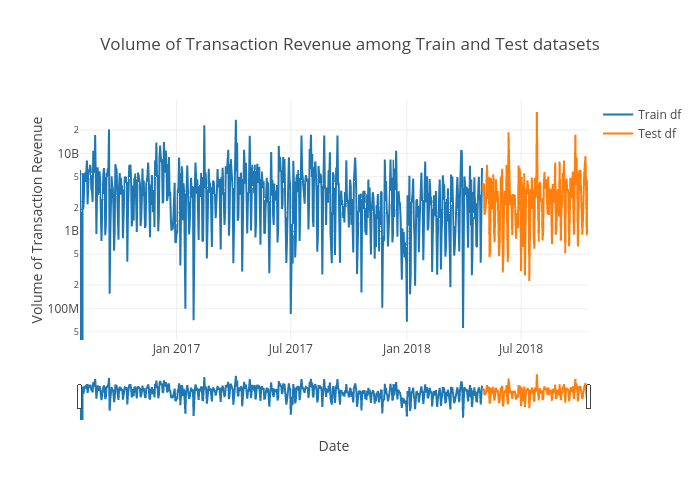
Codeastar's interactive graph and data of "Volume of Transaction Revenue among Train and Test datasets" is a line chart, showing Train df vs Test df; with Date in the x-axis and Volume of Transaction Revenue in the y-axis.. The x-axis shows values from 2016-08-01 to 2018-10-15. The y-axis shows values from 7.592725872985314 to 10.68799825845247.