Edit chart
Loading graph
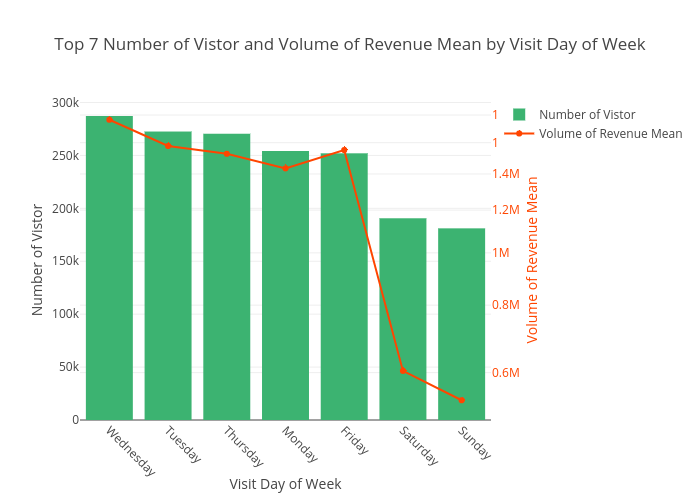
Codeastar's interactive graph and data of "Top 7 Number of Vistor and Volume of Revenue Mean by Visit Day of Week" is a bar chart, showing Number of Vistor vs Volume of Revenue Mean; with Visit Day of Week in the x-axis and Number of Vistor in the y-axis.. The x-axis shows values from -0.5 to 6.5. The y-axis shows values from 0 to 302395.7894736842.