Edit chart
Loading graph
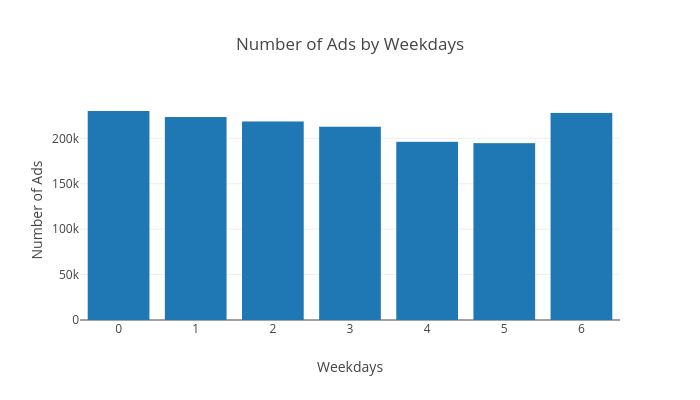
Codeastar's interactive graph and data of "Number of Ads by Weekdays" is a bar chart; with Weekdays in the x-axis and Number of Ads in the y-axis.. The x-axis shows values from -0.5 to 6.5. The y-axis shows values from 0 to 242163.15789473685.