Edit chart
Loading graph
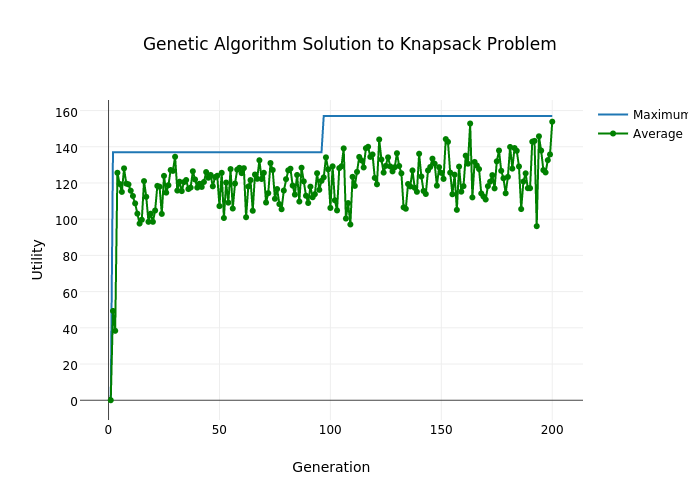
Collierab's interactive graph and data of "Genetic Algorithm Solution to Knapsack Problem" is a scatter chart, showing Maximum vs Average; with Generation in the x-axis and Utility in the y-axis.. The x-axis shows values from -11.54632012352033 to 212.54632012352033. The y-axis shows values from -10.398893835154096 to 165.81046809658127.