0
20
40
60
80
100
120
140
0
20
40
60
80
100
120
140
0
1
2
3
4
5
6
7
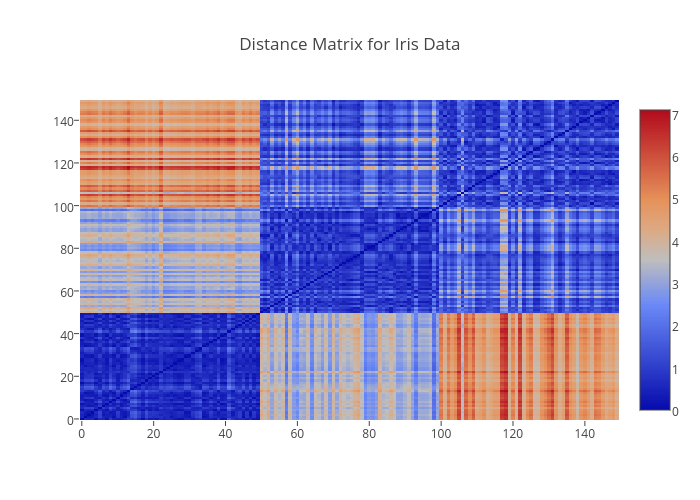
Distance Matrix for Iris Data
plotly-logomark
Edit chart
Collierab's interactive graph and data of "Distance Matrix for Iris Data" is a heatmap. The x-axis shows values from -0.5 to 149.5. The y-axis shows values from -0.5 to 149.5.