Edit chart
Loading graph
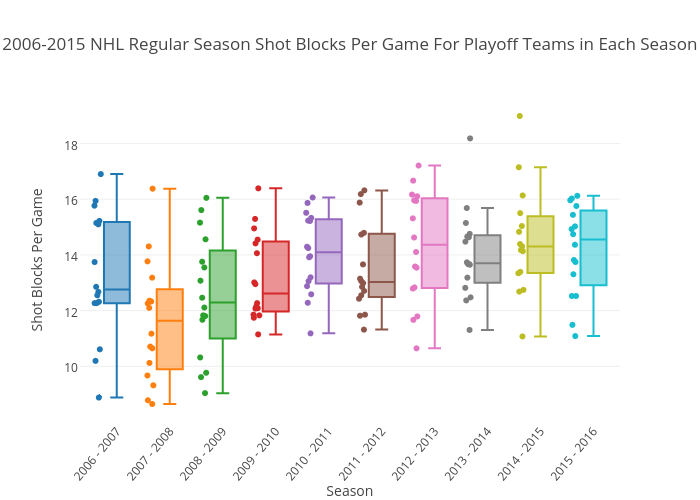
Coristig's interactive graph and data of "2006-2015 NHL Regular Season Shot Blocks Per Game For Playoff Teams in Each Season" is a box plot, showing 2006 - 2007, 2007 - 2008, 2008 - 2009, 2009 - 2010, 2010 - 2011, 2011 - 2012, 2012 - 2013, 2013 - 2014, 2014 - 2015, 2015 - 2016; with Season in the x-axis and Shot Blocks Per Game in the y-axis.. The x-axis shows values from -0.696 to 9.5. The y-axis shows values from 8.07181571815718 to 19.562330623306234.