Edit chart
Loading graph
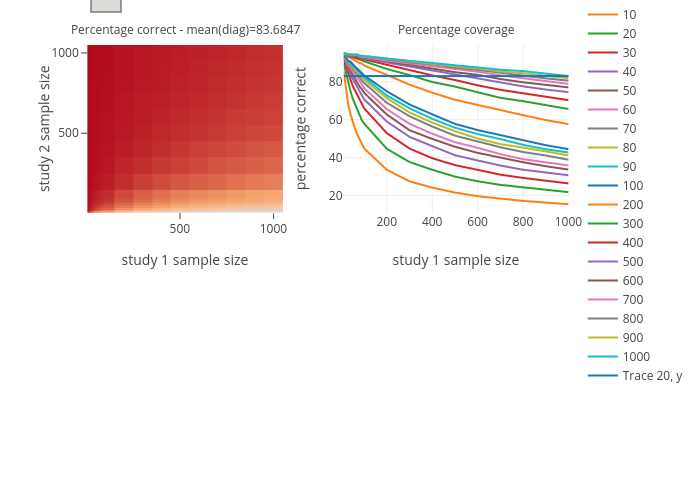
Cpernet's interactive graph and data of "Percentage correct - mean(diag)=83.6847" is a heatmap, showing Trace 0, y, 10, 20, 30, 40, 50, 60, 70, 80, 90, 100, 200, 300, 400, 500, 600, 700, 800, 900, 1000, Trace 20, y; with study 1 sample size in the x-axis and study 2 sample size in the y-axis.. The x-axis shows values from 5 to 1050. The y-axis shows values from 5 to 1050. This visualization has the following annotations: Percentage correct - mean(diag)=83.6847; Percentage coverage