Edit chart
Loading graph
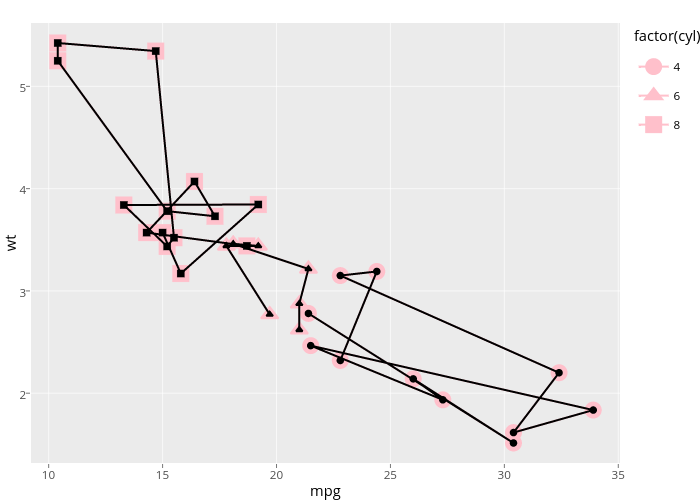
Cpsievert's interactive graph and data of "wt vs mpg" is a , showing 4, 6, 8, 4, 6, 8; with mpg in the x-axis and wt in the y-axis.. The x-axis shows values from 9.225 to 35.075. The y-axis shows values from 1.31745 to 5.61955. This visualization has the following annotation: factor(cyl)