Edit chart
Loading graph
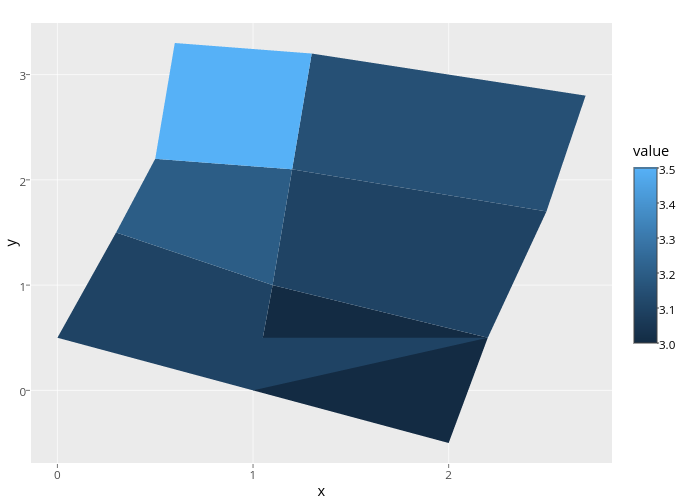
Cpsievert's interactive graph and data of "y vs x" is a filled line chart, showing , , , , , 99_9db0a15cab03fbee16029f26173bda90; with x in the x-axis and y in the y-axis.. The x-axis shows values from -0.135 to 2.835. The y-axis shows values from -0.69 to 3.49.