Edit chart
Loading graph
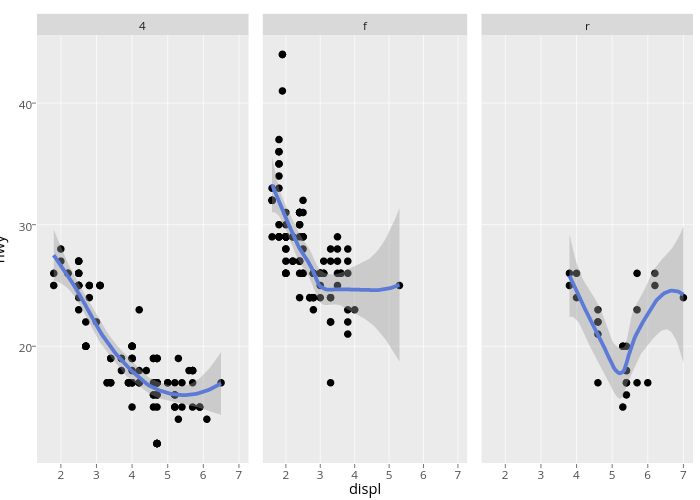
Cpsievert's interactive graph and data of ", , , fitted values, fitted values, fitted values, , , " is a scatter chart, showing , , , fitted values, fitted values, fitted values, , , . The x-axis shows values from 1.33 to 7.27. The y-axis shows values from 10.4 to 45.6. This visualization has the following annotations: displ; hwy; 4; f; r