Edit chart
Loading graph
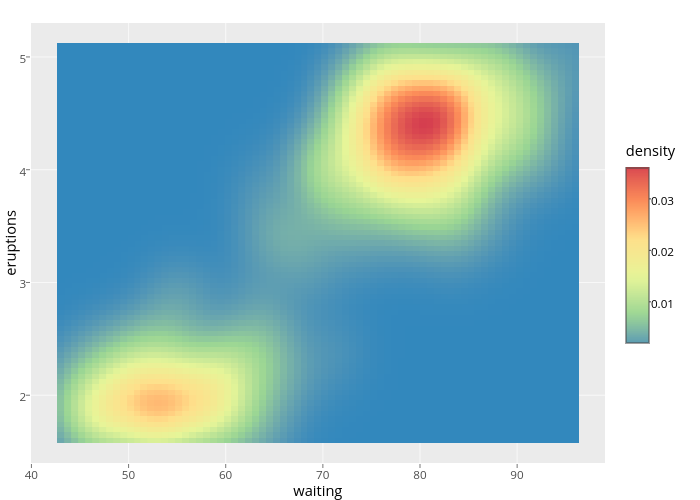
Cpsievert's interactive graph and data of "eruptions vs waiting" is a heatmap, showing vs 99_55e41fa9d911847023b844bf16117e46; with waiting in the x-axis and eruptions in the y-axis.. The x-axis shows values from 39.9560810810811 to 99.0439189189189. The y-axis shows values from 1.39898648648649 to 5.30101351351351.