Edit chart
Loading graph
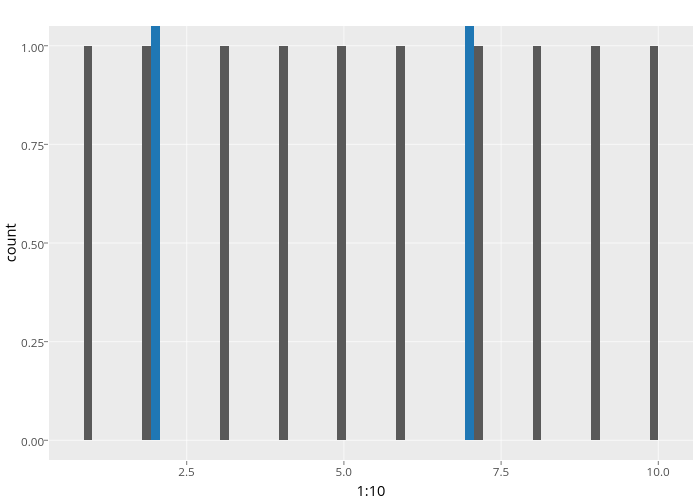
Cpsievert's interactive graph and data of "count vs 1:10" is a stacked bar chart; with 1:10 in the x-axis and count in the y-axis.. The x-axis shows values from 0.310344827586207 to 10.551724137931. The y-axis shows values from -0.05 to 1.05.