Edit chart
Loading graph
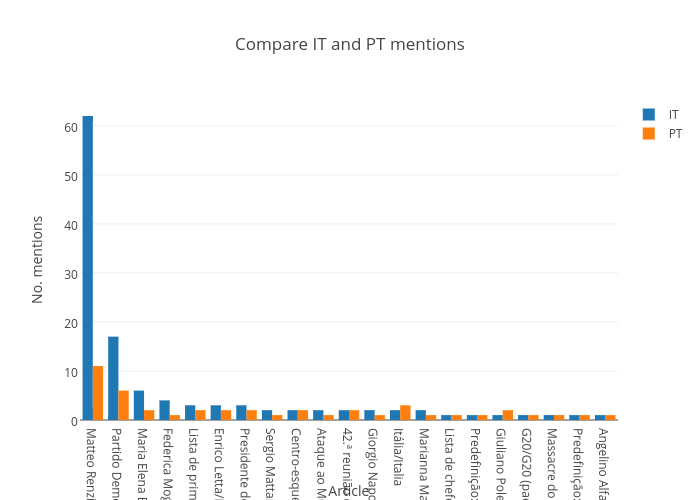
Crimenghini's interactive graph and data of "Compare IT and PT mentions" is a bar chart, showing IT vs PT; with Article in the x-axis and No. mentions in the y-axis.. The x-axis shows values from 0 to 0. The y-axis shows values from 0 to 0.