Edit chart
Loading graph
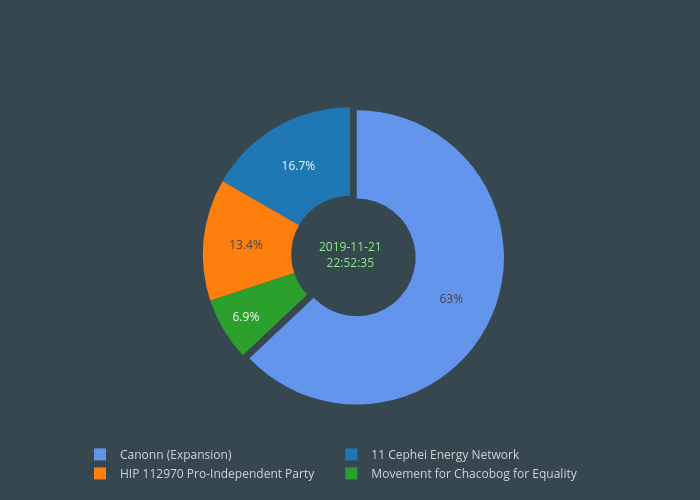
Criosix's interactive graph and data is a pie. The x-axis shows values from 0 to 0. The y-axis shows values from 0 to 0. This visualization has the following annotation: 2019-11-2122:52:35