Edit chart
Loading graph
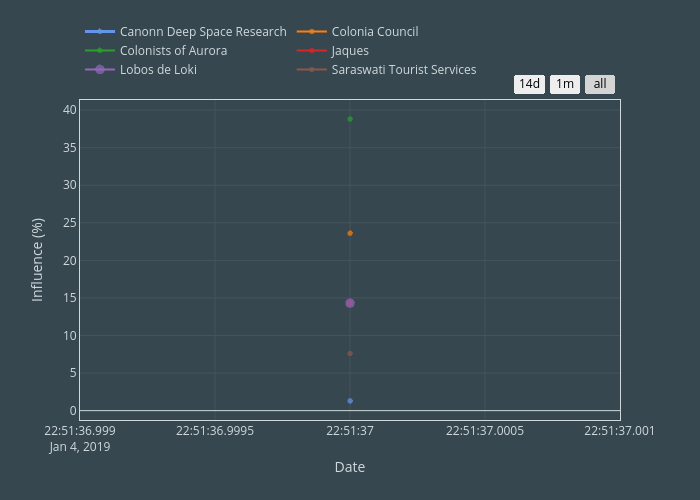
Criosix's interactive graph and data of "Influence (%) vs Date" is a line chart, showing Canonn Deep Space Research, Colonia Council, Colonists of Aurora, Jaques, Lobos de Loki, Saraswati Tourist Services; with Date in the x-axis and Influence (%) in the y-axis.. The x-axis shows values from 0 to 0. The y-axis shows values from 0 to 0.