Edit chart
Loading graph
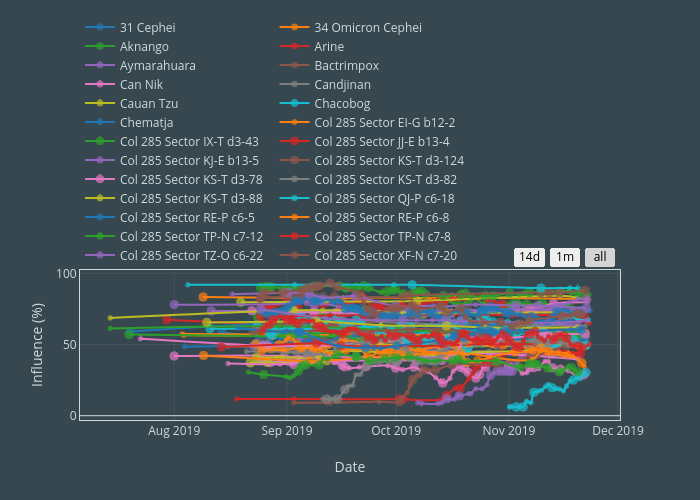
Criosix's interactive graph and data of "Influence (%) vs Date" is a line chart, showing 31 Cephei, 34 Omicron Cephei, Aknango, Arine, Aymarahuara, Bactrimpox, Can Nik, Candjinan, Cauan Tzu, Chacobog, Chematja, Col 285 Sector EI-G b12-2, Col 285 Sector IX-T d3-43, Col 285 Sector JJ-E b13-4, Col 285 Sector KJ-E b13-5, Col 285 Sector KS-T d3-124, Col 285 Sector KS-T d3-78, Col 285 Sector KS-T d3-82, Col 285 Sector KS-T d3-88, Col 285 Sector QJ-P c6-18, Col 285 Sector RE-P c6-5, Col 285 Sector RE-P c6-8, Col 285 Sector TP-N c7-12, Col 285 Sector TP-N c7-8, Col 285 Sector TZ-O c6-22, Col 285 Sector XF-N c7-20, Diabozo, Elboongzi, Evenses, Gilyan, HIP 110094, HIP 112970, HIP 114099, HIP 2293, HIP 89478, HIP 90760, HIP 94126, Hementrim, Ix Chodharr, Jarildekald, Khun, Krumine, Lumaragro, Mahatrents, Masai, Ngundjedes, Njoere, Nones, Othelkan, Parinta, Popon, Potilo, Su Li Er, Suhte, Undalibaluf, Varati; with Date in the x-axis and Influence (%) in the y-axis.. The x-axis shows values from 0 to 0. The y-axis shows values from 0 to 0.