Edit chart
Loading graph
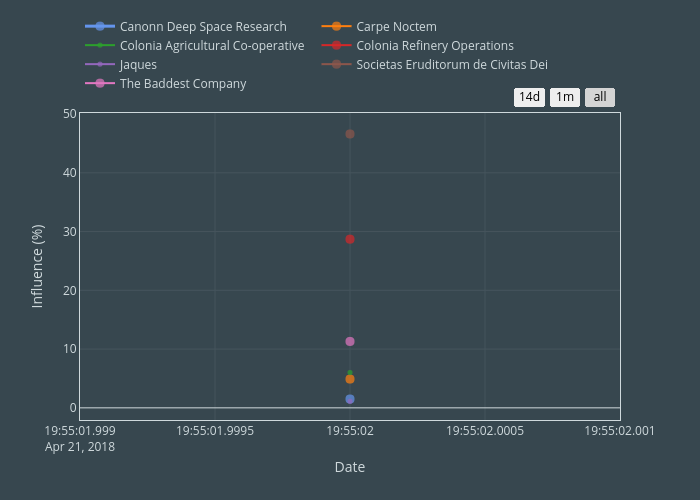
Criosix's interactive graph and data of "Influence (%) vs Date" is a line chart, showing Canonn Deep Space Research, Carpe Noctem, Colonia Agricultural Co-operative, Colonia Refinery Operations, Jaques, Societas Eruditorum de Civitas Dei, The Baddest Company; with Date in the x-axis and Influence (%) in the y-axis.. The x-axis shows values from 0 to 0. The y-axis shows values from 0 to 0.