Edit chart
Loading graph
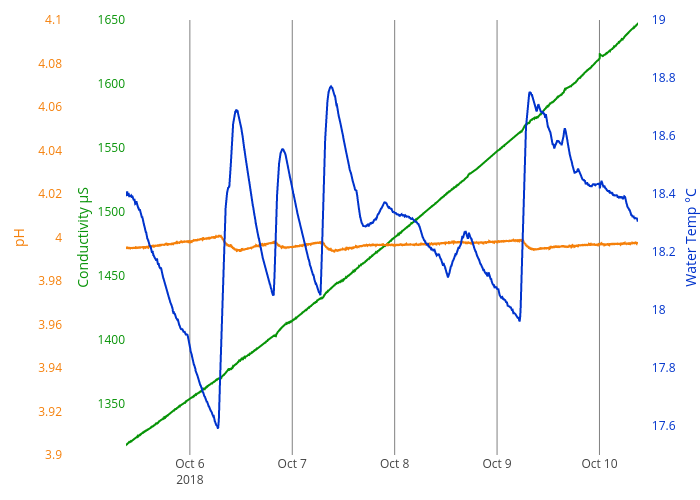
Crj11's interactive graph and data of "Conductivity μS vs time" is a line chart, showing EC, pH, Water Temp; with time in the x-axis and Conductivity μS in the y-axis.. The x-axis shows values from 2018-10-05 09:02 to 2018-10-10 09:02. The y-axis shows values from 1310 to 1650.