Deal Volume
50
100
150
200
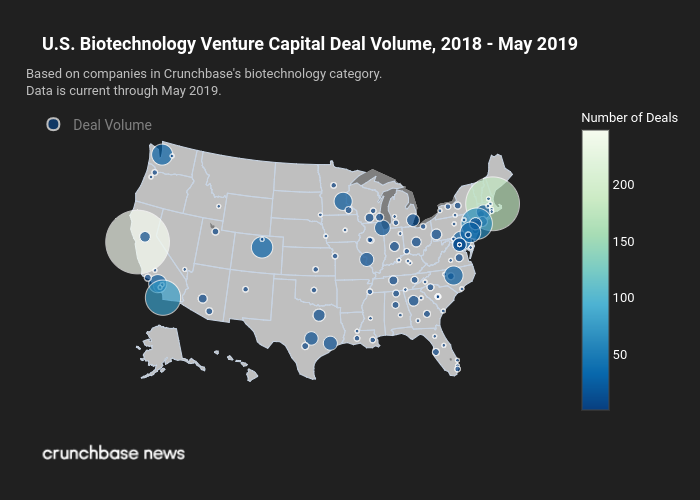
Number of Deals
U.S. Biotechnology Venture Capital Deal Volume, 2018 - May 2019
Based on companies in Crunchbase's biotechnology category.
Data is current through May 2019.
plotly-logomark
Edit chart
Loading graph
Crunchbasenews's interactive graph and data of "U.S. Biotechnology Venture Capital Deal Volume, 2018 - May 2019" is a scattergeo, showing Deal Volume. The x-axis shows values from -1 to 6. The y-axis shows values from -1 to 4. This visualization has the following annotation: Based on companies in Crunchbase's biotechnology category.Data is current through May 2019.