Edit chart
Loading graph
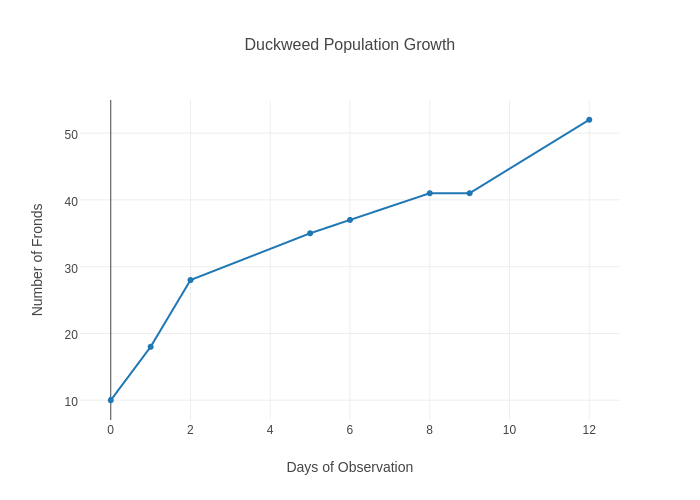
Csnyder's interactive graph and data of "Duckweed Population Growth " is a scatter chart, showing Col2; with Days of Observation in the x-axis and Number of Fronds in the y-axis.. The x-axis shows values from -0.7301829268292683 to 12.730182926829269. The y-axis shows values from 7.102514506769826 to 54.89748549323017.