Edit chart
Loading graph
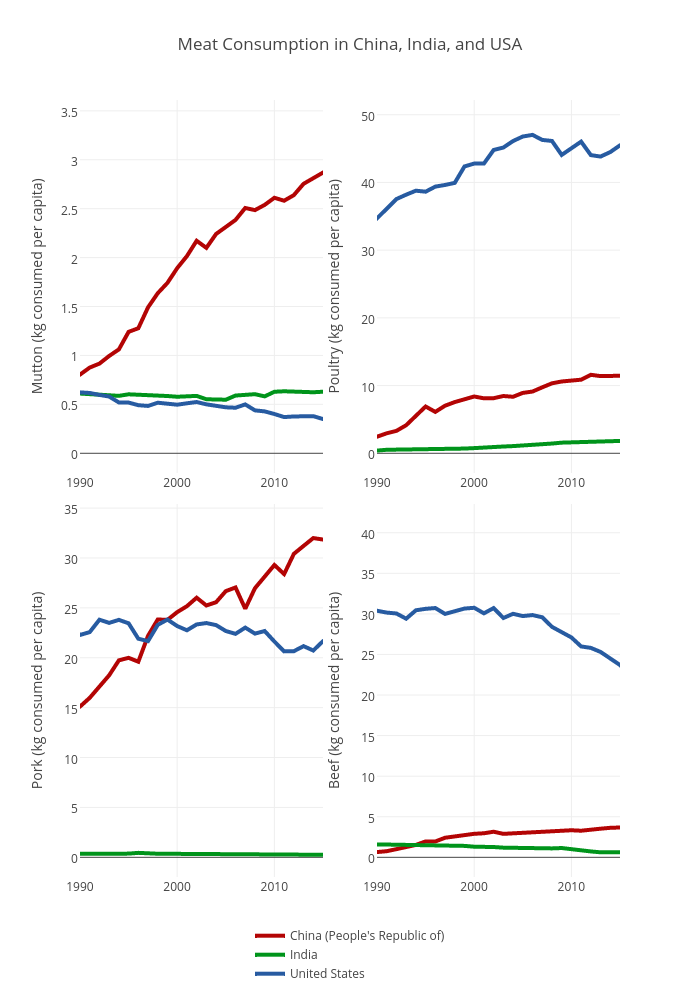
Cximran's interactive graph and data of "Meat Consumption in China, India, and USA" is a scatter chart, showing China (People's Republic of), India, United States, China (People's Republic of), India, United States, China (People's Republic of), India, United States, China (People's Republic of), India, United States. The x-axis shows values from 0 to 0. The y-axis shows values from 0 to 0.