Edit chart
Loading graph
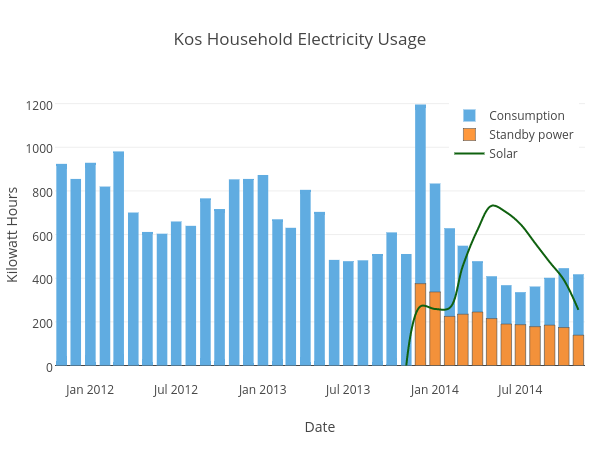
Dailykos's interactive graph and data of "Kos Household Electricity Usage" is a overlaid bar chart, showing Consumption, Standby power, Solar; with Date in the x-axis and Kilowatt Hours in the y-axis.. The x-axis shows values from 1318921200000 to 1416034800000. The y-axis shows values from -66.44444444444444 to 1262.4444444444443.