Edit chart
Loading graph
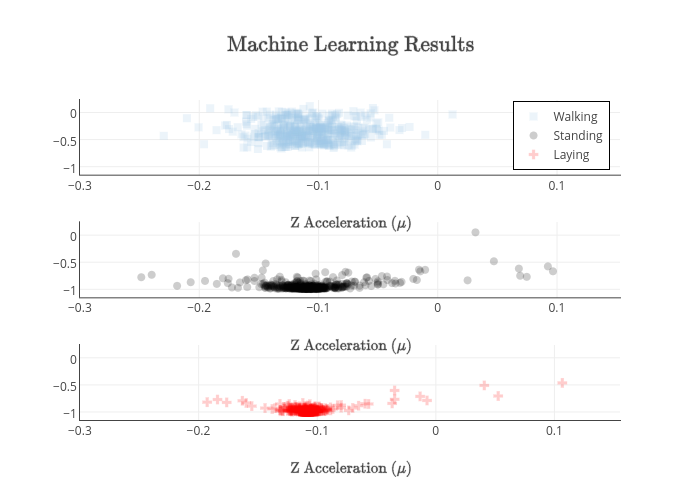
Damienrj's interactive graph and data of "$\text{Machine Learning Results}$" is a scatter chart, showing Walking, Standing, Laying; with $\text{Z Acceleration } (\mu)$ in the x-axis and $\text{Z Acceleration } (\sigma)$ in the y-axis.. The x-axis shows values from -0.3 to 0.15522263583567814. The y-axis shows values from -1.1470567934353162 to 0.22976500738905675.