Edit chart
Loading graph
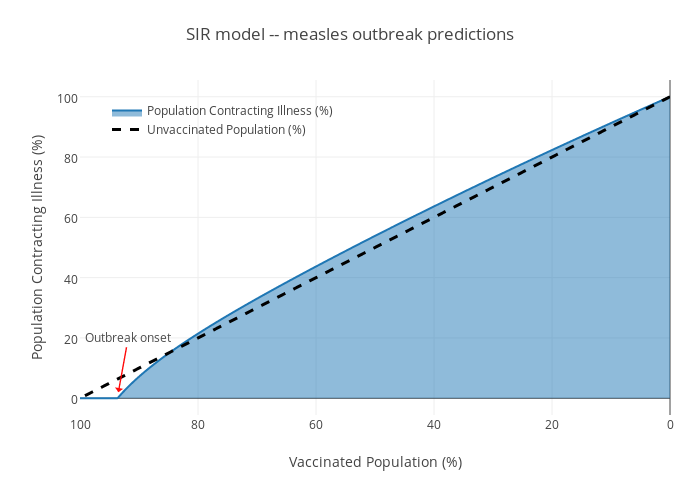
Damienrj's interactive graph and data of "SIR model -- measles outbreak predictions" is a filled scatter chart, showing Population Contracting Illness (%) vs Unvaccinated Population (%); with Vaccinated Population (%) in the x-axis and Population Contracting Illness (%) in the y-axis.. The x-axis shows values from 100 to 0. The y-axis shows values from -5.555555555555555 to 105.55555555555556. This visualization has the following annotation: Outbreak onset