Edit chart
Loading graph
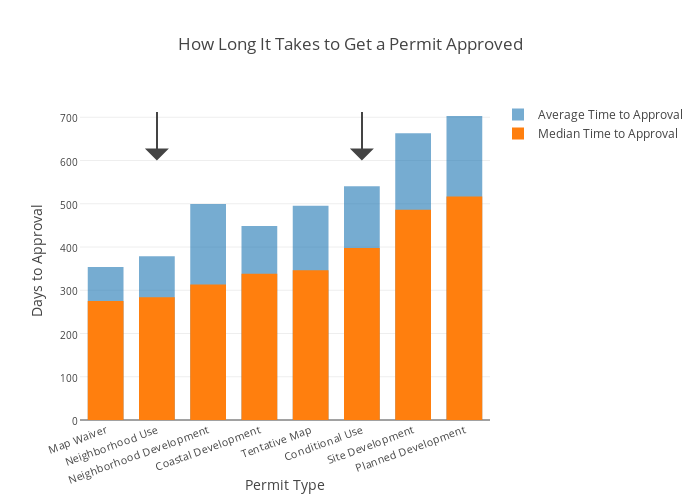
Damoncrockett's interactive graph and data of "How Long It Takes to Get a Permit Approved" is a overlaid bar chart, showing Average Time to Approval vs Median Time to Approval; with Permit Type in the x-axis and Days to Approval in the y-axis.. The x-axis shows values from 0.5 to 8.5. The y-axis shows values from 0 to 739.9538993469074.