Edit chart
Loading graph
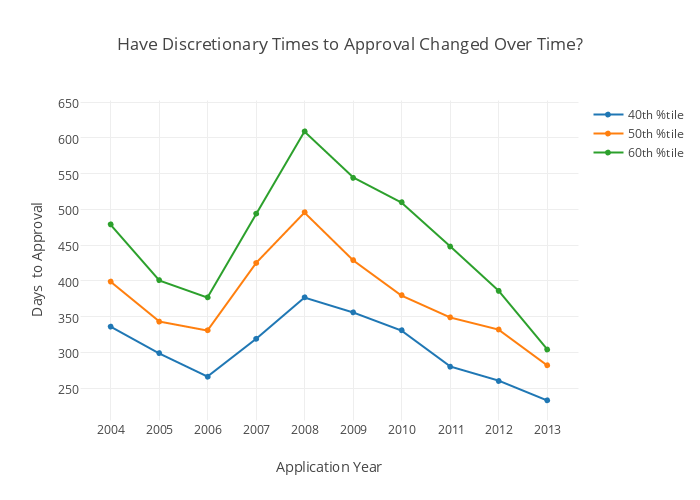
Damoncrockett's interactive graph and data of "Have Discretionary Times to Approval Changed Over Time?" is a scatter chart, showing 40th %tile, 50th %tile, 60th %tile; with Application Year in the x-axis and Days to Approval in the y-axis.. The x-axis shows values from 2003.46356747304 to 2013.53643252696. The y-axis shows values from 207.82969390674168 to 651.5905406694002.