Edit chart
Loading graph
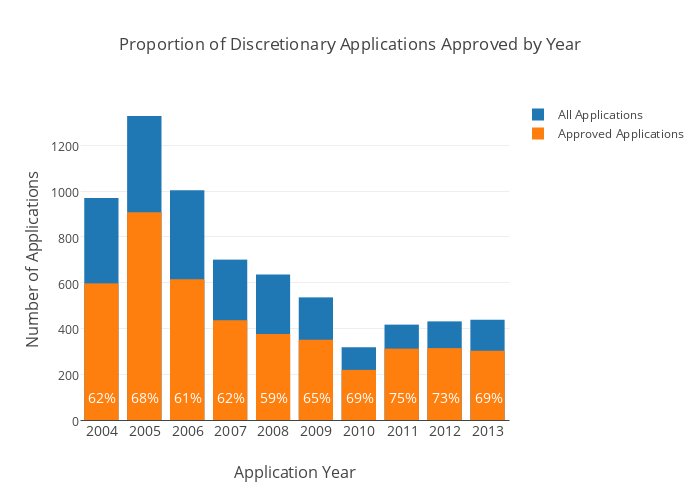
Damoncrockett's interactive graph and data of "Proportion of Discretionary Applications Approved by Year" is a overlaid bar chart, showing All Applications vs Approved Applications; with Application Year in the x-axis and Number of Applications in the y-axis.. The x-axis shows values from 2003.5 to 2013.5. The y-axis shows values from 0 to 1397.8947368421052. This visualization has the following annotations: 62%; 68%; 61%; 62%; 59%; 65%; 69%; 75%; 73%; 69%