Edit chart
Loading graph
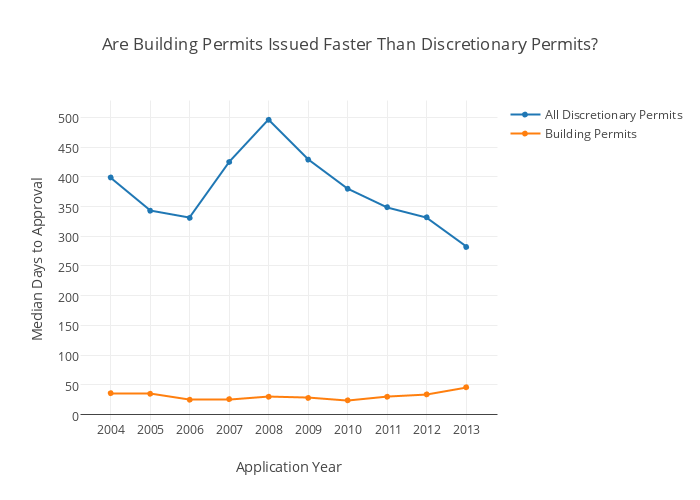
Damoncrockett's interactive graph and data of "Are Building Permits Issued Faster Than Discretionary Permits?" is a scatter chart, showing All Discretionary Permits vs Building Permits; with Application Year in the x-axis and Median Days to Approval in the y-axis.. The x-axis shows values from 2003.45207364525 to 2013.54792635475. The y-axis shows values from -6.19769557307459 to 526.1976955730746.