Edit chart
Loading graph
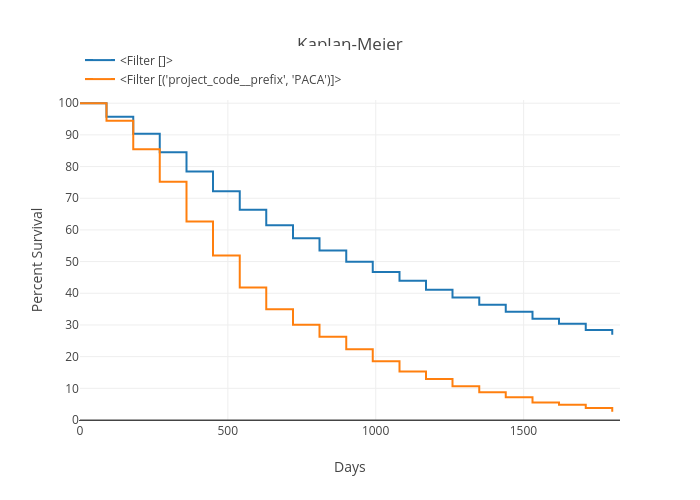
Dandanxu's interactive graph and data of "Kaplan-Meier" is a line chart, showing vs ; with Days in the x-axis and Percent Survival in the y-axis.. The x-axis shows values from 0 to 1826. The y-axis shows values from 0 to 101.