Edit chart
Loading graph
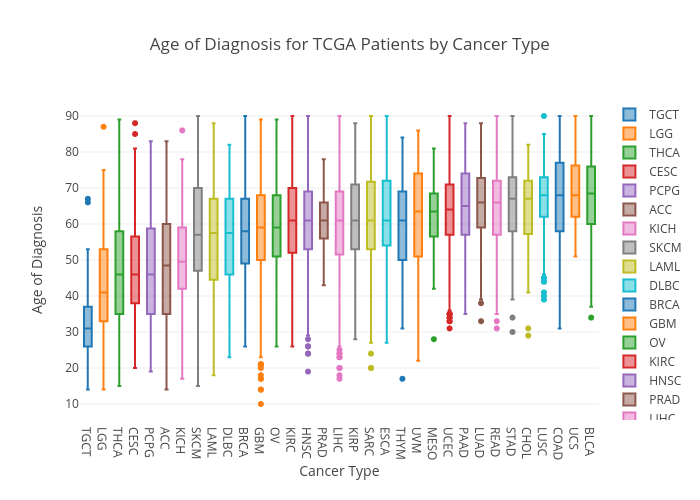
Dandanxu's interactive graph and data of "Age of Diagnosis for TCGA Patients by Cancer Type" is a box plot, showing TGCT, LGG, THCA, CESC, PCPG, ACC, KICH, SKCM, LAML, DLBC, BRCA, GBM, OV, KIRC, HNSC, PRAD, LIHC, KIRP, SARC, ESCA, THYM, UVM, MESO, UCEC, PAAD, LUAD, READ, STAD, CHOL, LUSC, COAD, UCS, BLCA; with Cancer Type in the x-axis and Age of Diagnosis in the y-axis.. The x-axis shows values from 0 to 0. The y-axis shows values from 0 to 0.