Edit chart
Loading graph
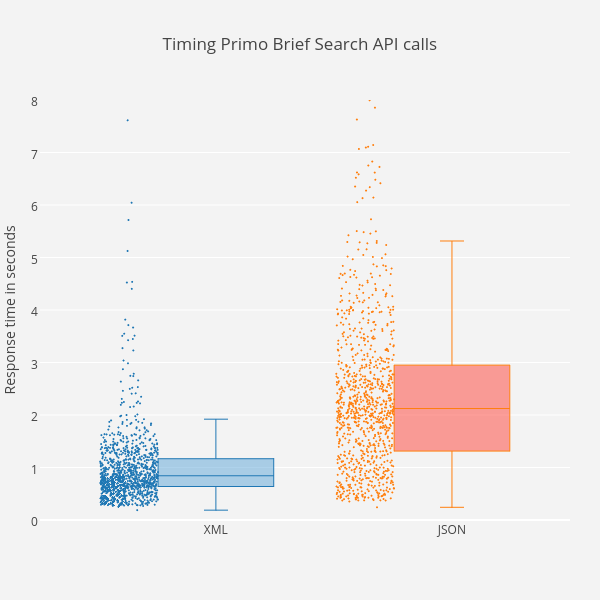
Danmichaelo's interactive graph and data of "Timing Primo Brief Search API calls" is a box plot, showing XML vs JSON; with Response time in seconds in the y-axis. The x-axis shows values from 0 to 0. The y-axis shows values from 0 to 8.