Edit chart
Loading graph
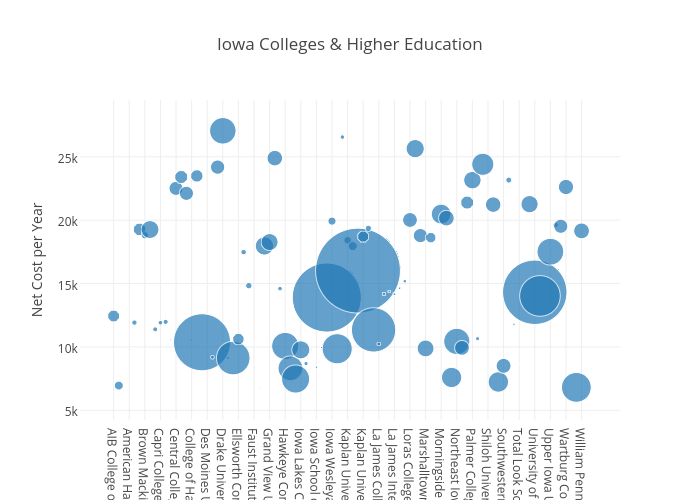
Darkgrey's interactive graph and data of "Iowa Colleges & Higher Education " is a scatter chart, showing Net Cost per Year; with Net Cost per Year in the y-axis. The x-axis shows values from -5.60965128256534 to 95.78725380005284. The y-axis shows values from 4829.975251961854 to 28948.19912991041.