Edit chart
Loading graph
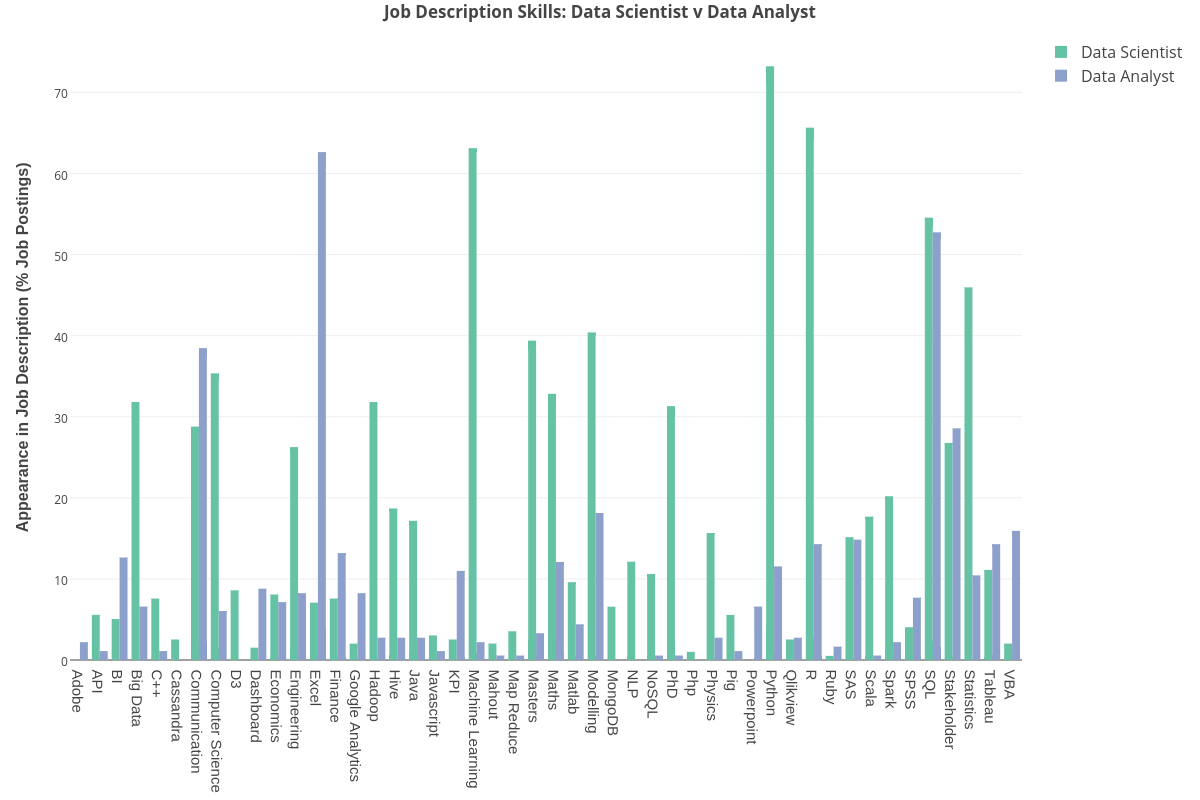
Dashee's interactive graph and data of "Job Description Skills: Data Scientist v Data Analyst" is a bar chart, showing Data Scientist vs Data Analyst; with Appearance in Job Description (% Job Postings) in the y-axis. The x-axis shows values from -0.5 to 47.5. The y-axis shows values from 0 to 77.0842105263158.