Edit chart
Loading graph
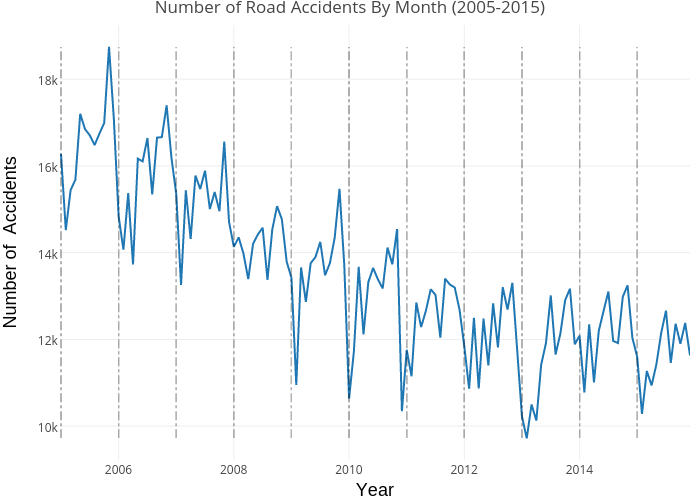
Dashee's interactive graph and data of "Number of Road Accidents By Month (2005-2015)" is a line chart; with Year in the x-axis and Number of Accidents in the y-axis.. The x-axis shows values from 0 to 0. The y-axis shows values from 0 to 0.