Edit chart
Loading graph
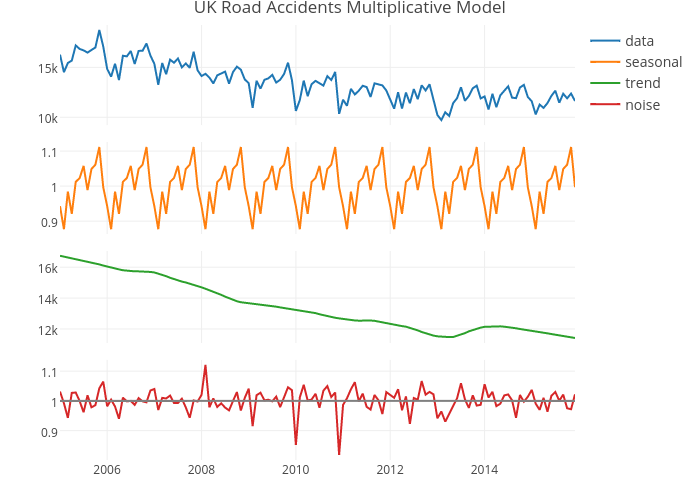
Dashee's interactive graph and data of "UK Road Accidents Multiplicative Model" is a line chart, showing data, seasonal, trend, noise, noise. The x-axis shows values from 0 to 0. The y-axis shows values from 0 to 0.