Edit chart
Loading graph
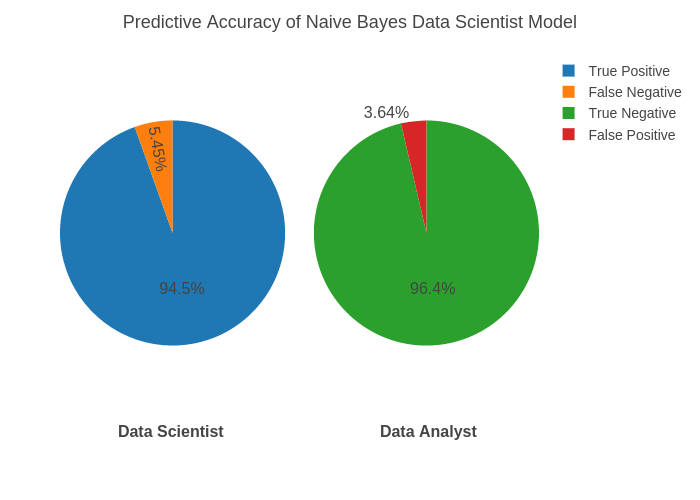
Dashee's interactive graph and data of "Predictive Accuracy of Naive Bayes Data Scientist Model" is a pie, showing Data Scientist vs Data Analyst. The x-axis shows values from 19.979768786127167 to 27.020231213872833. The y-axis shows values from -1.0043383947939262 to 0.004338394793926247. This visualization has the following annotations: Data Scientist; Data Analyst