Edit chart
Loading graph
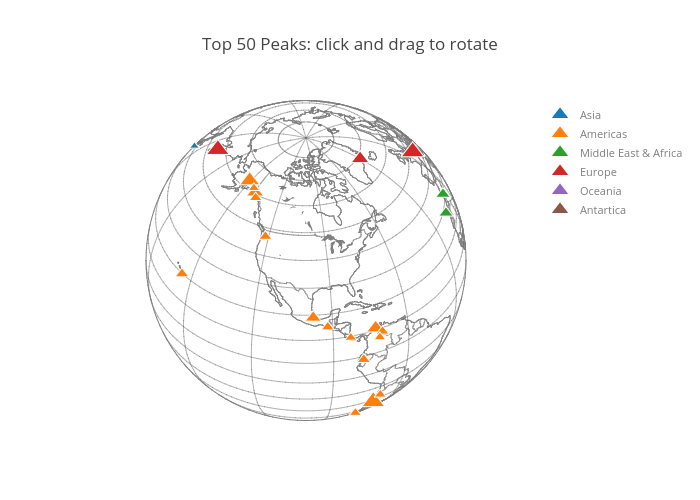
Dataremixed's interactive graph and data of "Top 50 Peaks: click and drag to rotate" is a scattergeo, showing Asia, Americas, Middle East & Africa, Europe, Oceania, Antartica. The x-axis shows values from 0 to 0. The y-axis shows values from 0 to 0.