Edit chart
Loading graph
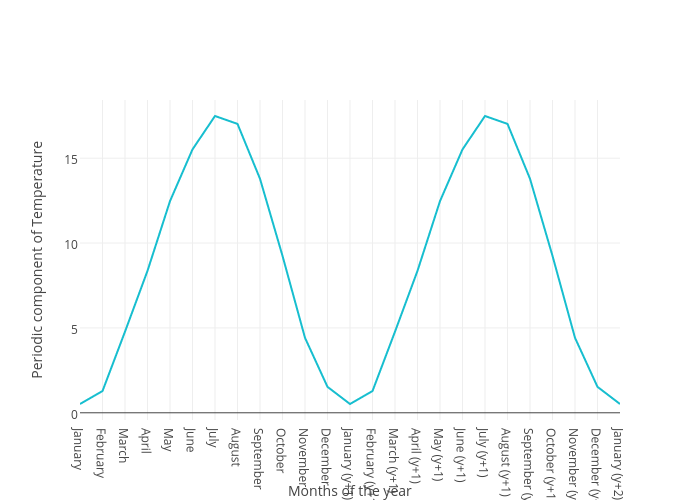
Datathings's interactive graph and data of "Periodic component of Temperature vs Months of the year" is a line chart, showing Periodic component of Temperature; with Months of the year in the x-axis and Periodic component of Temperature in the y-axis.. The x-axis shows values from 0 to 24. The y-axis shows values from -0.42556617171643285 to 18.426855251343603.