Edit chart
Loading graph
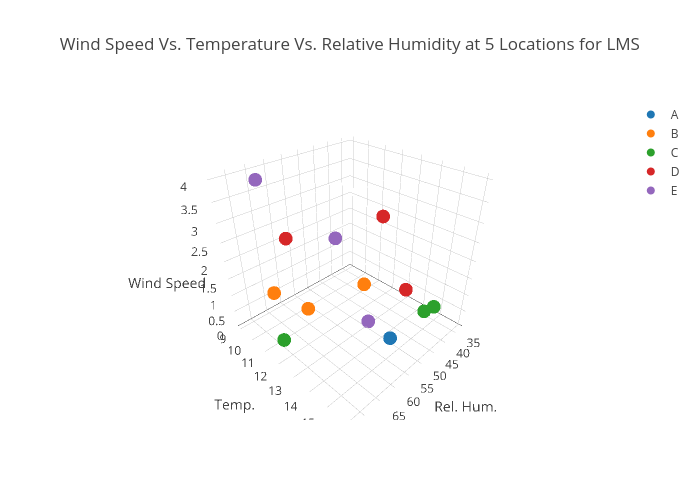
Dave.crowder's interactive graph and data of "Wind Speed Vs. Temperature Vs. Relative Humidity at 5 Locations for LMS" is a scatter3d, showing A, B, C, D, E. The x-axis shows values from 0 to 0. The y-axis shows values from 0 to 0.