Edit chart
Loading graph
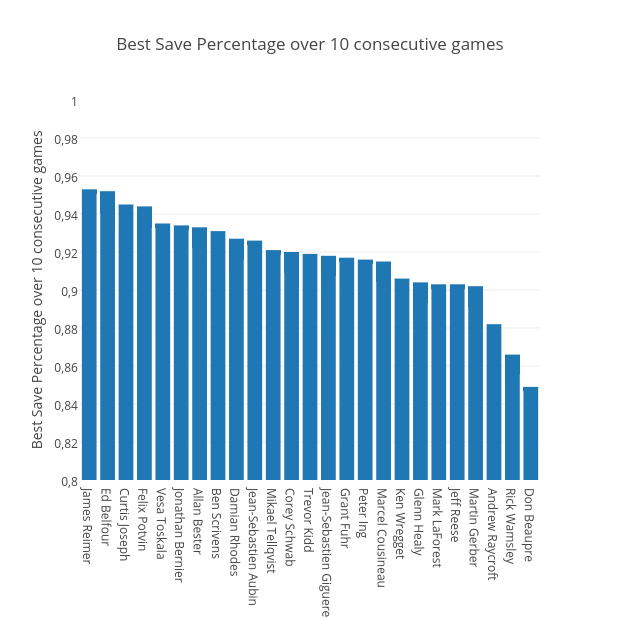
Davidalter's interactive graph and data of "Best Save Percentage over 10 consecutive games" is a bar chart, showing Col3; with Best Save Percentage over 10 consecutive games in the y-axis. The x-axis shows values from 0.5 to 25.5. The y-axis shows values from 0.8 to 1.