Edit chart
Loading graph
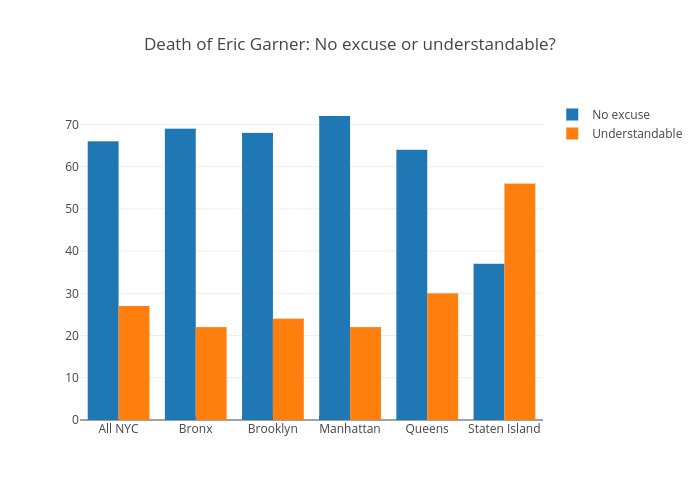
Davidljarman's interactive graph and data of "Death of Eric Garner: No excuse or understandable?" is a bar chart, showing No excuse vs Understandable. The x-axis shows values from -0.5 to 5.5. The y-axis shows values from 0 to 75.78947368421052.