Edit chart
Loading graph
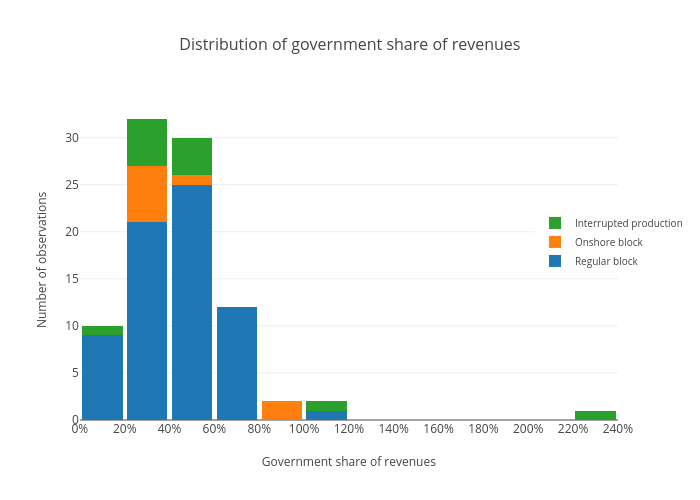
Davidmihalyi's interactive graph and data of "Distribution of government share of revenues" is a histogram, showing Regular block, Onshore block, Interrupted production; with Government share of revenues in the x-axis and Number of observations in the y-axis.. The x-axis shows values from 0 to 2.4. The y-axis shows values from 0 to 34.